You are a business owner running multiple businesses and handling infrastructure. Everything is going well until one of your business users faces downtime and unavailability, and you are unable to pinpoint the cause.
There come the Service Monitoring
What is Service Monitoring:
A measurable goal for service performance over a period of time. Monitoring the health of Google Cloud microservices by providing the tools to set up alerting policies on the performance of service level objectives (SLOs).
Core Concepts of Service Monitoring:
- Service Level Objectives(SLOs).
- Service Level Indicators(SLIs).
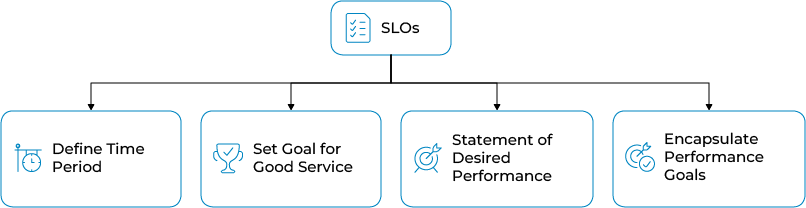
What are SLOs:
SLOs define a time period for compliance and set a goal for good service. They are also considered a statement of desired performance. Moreover, they encapsulate your performance goals for the service.
What are SLIs:
SLIs collect metrics that measure the performance of the service infrastructure. The performance metrics are the basis of the SLIs for your service. It describes the performance of a particular aspect of your service.

If your service has request-count or response-latency metrics, then SLIs can be derived from those by creating a ratio. i-e
- Availability
- Latency
Availability SLI:
Ratio of number of successful responses to the number of all responses.
Determining how available your service was to users.
Latency SLI:
Ratio of number of calls below a latency threshold to the number of all calls.
Measures how quickly your service responded to users. You’ll get a metric related to how many responses were faster than a threshold that you define.
Some service-specific SLIs used for the evaluation method of how compliant the service is are :
- Request-based SLIs
- Windows-based SLIs
Request-based SLIs:
Counts individual events, letting you know how well your service performed over the entire compliance period, regardless of load distribution.
Windows Based SLIs:
Counts good minutes versus bad minutes according to the criteria you define.
This lets you measure performance in terms of time, regardless of how the load is distributed.
Creating and Implementing SLO:
Prerequisites:
- To view and create SLOs, one should have the Monitoring Editor Role: (roles/monitoring.editor).
- Cloud Monitoring API should be enabled.
- The following types of potential services should be listed if selecting a candidate service:
- Cloud Run
- App Engine
- GKE Service
- Istio on GKE
- GKE Workload
- GKE Namespace
- Cloud Service Mesh
Setting up SLO:
- Navigate to the GCP Console and search for SLOs.
- On the SLOs Tab, look for Define a service.
- After clicking Submit on Define a service pop-up, click +Create SLO.
- New pop-up appears to:
- Set your service-level indicator.
- Define SLI details.
- Set your service-level objective.
- Review and Save.
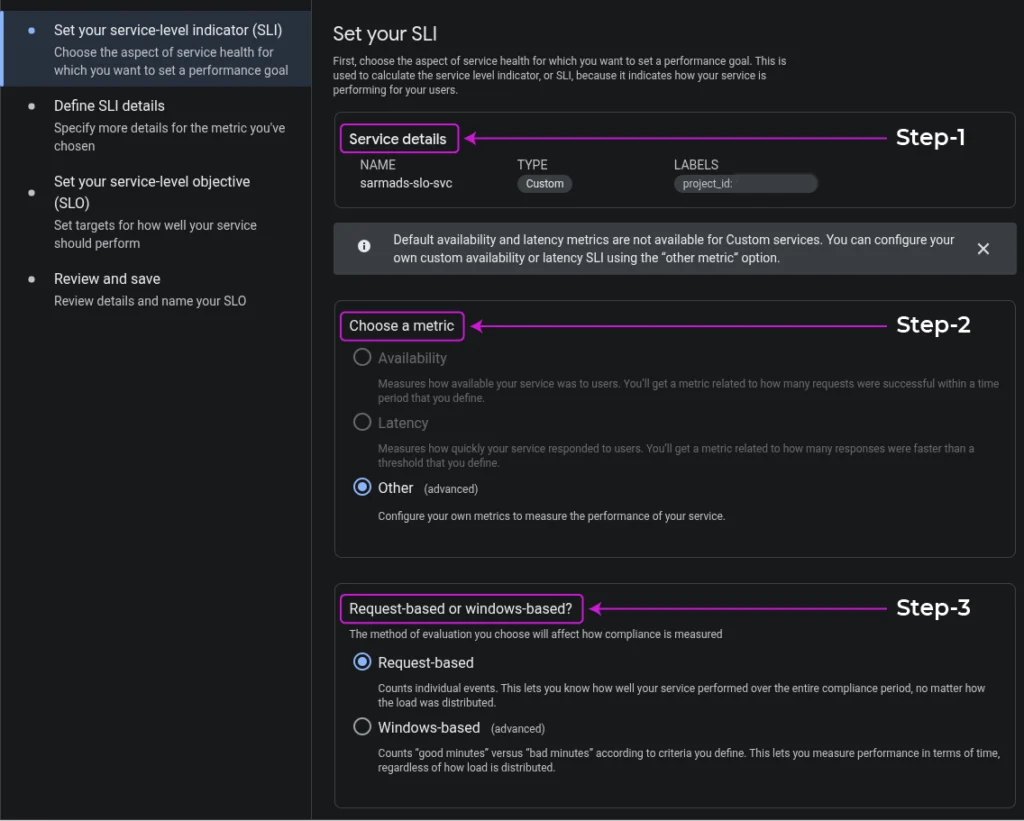
Setting up SLI:
Setting up the SLI is divided into multiple chunks.
- Choose the aspect of service health for which you want to set a performance goal:
- Service Details.
- Choosing a metric (Availability, Latency, Other).
Note: Default availability and latency metrics are not available for Custom services. You can configure your own custom availability or latency SLI using the other metric option. - Measuring compliance by choosing an evaluation method (Request-based, Windows-based).
- Click Continue.
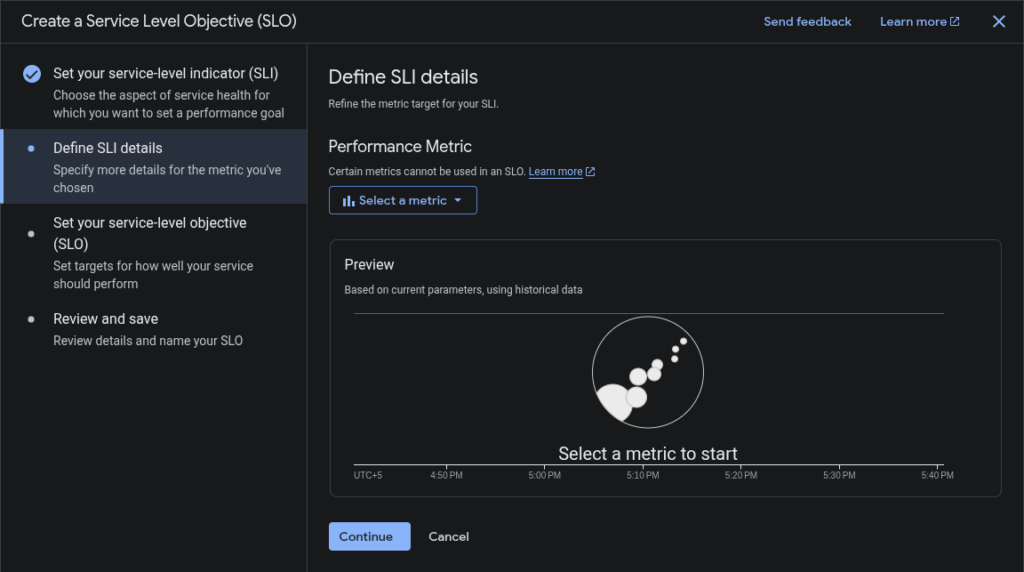
- Define SLI details:
Contents within the SLI details pop-up depend on the metric and evaluation method picked previously,- If you select the availability metric and request-based evaluation, it asks for no other details.
- If you select the Windows-based evaluation, it asks for additional information.
- If you select a latency metric, it asks for a threshold value used to determine the performance.
- If you select another metric, you specify the metric you want to use from the Performance metric list.
- After specifying the SLI details, you get a preview chart showing how the historical performance of the selected service is measured.
- Click Continue.
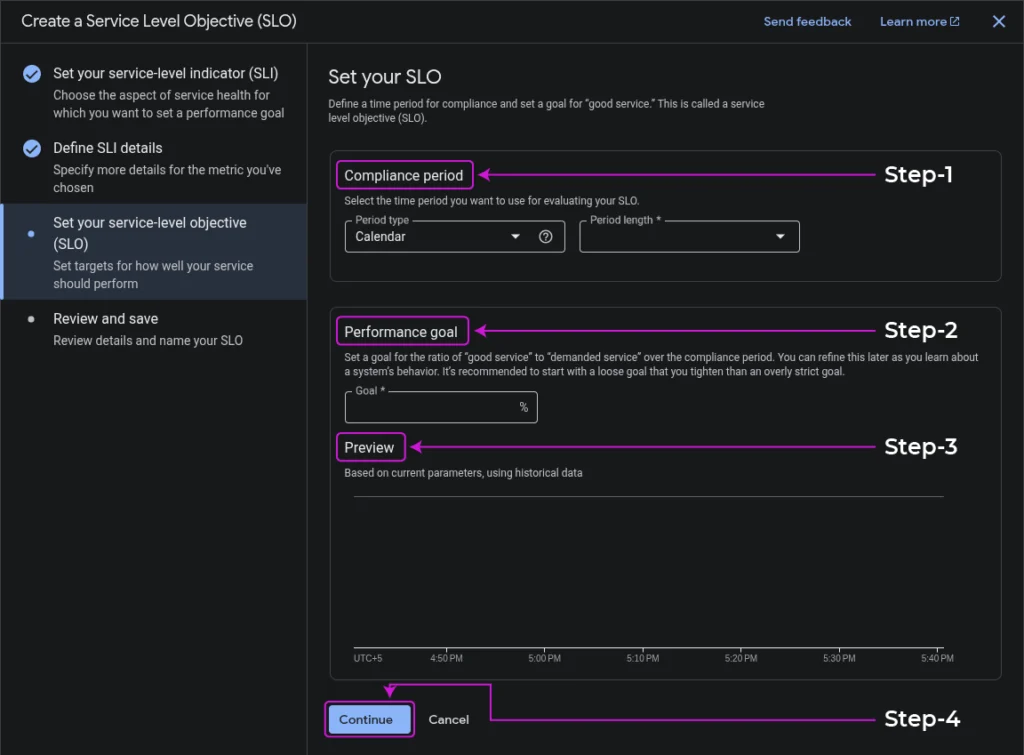
- Set your SLO:
- Select a Compliance Period you want to use for your SLO, specifying the Period type and Period length.
- Set a performance goal for the ratio of good service to demanded service.
- After setting SLO, you get a preview chart based on the current parameters using historical data.
- Click Continue.
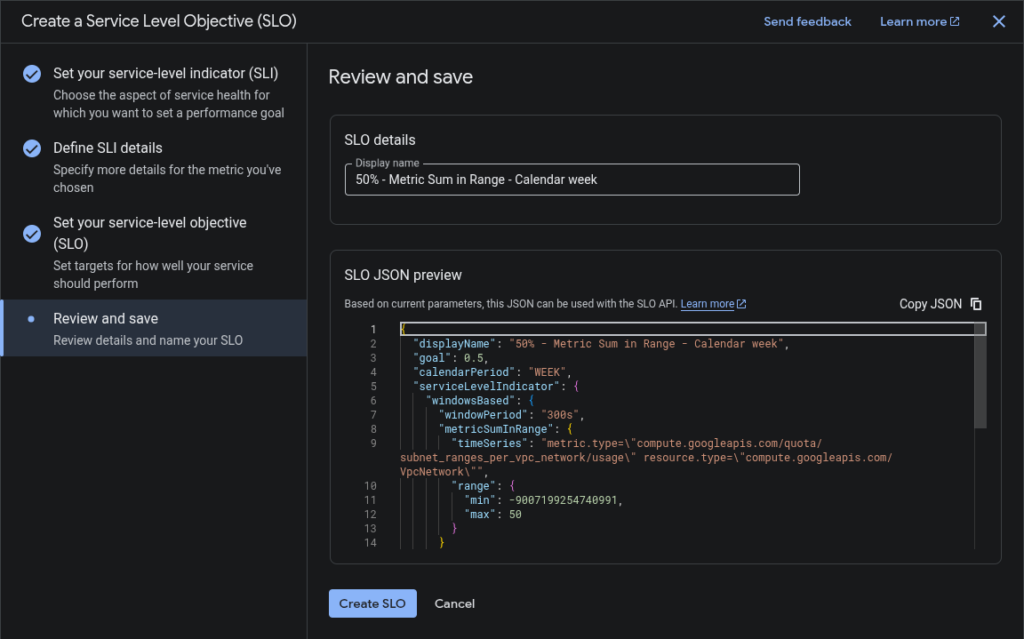
- Review and Save:
- The last step while setting the SLI. It gives the Display Name for SLO and its JSON Preview.
- Click Create SLO.
After creating the SLO, your dashboard will show your service and the current status of SLOs.
Using SLO-based alerts:
You create one or more alerting policies to monitor the error budget for your SLO.
The policy job is to warn you when your service is consuming the error budget quickly.
You can create the alerting policy either from the Console or the API.
Types of Error-budget alerts:
- Fast Burn Alert
- Slow Burn Alert
Fast Burn Alert:
A specific type of alert that warns you if a large, sudden change in consumption is noticed, which utilizes the error-budget quickly.
Slow Burn Alert:
A specific type of alert that warns you if the rate of consumption is not changed, and it will consume the error budget before the compliance period ends.
Conclusion:
In conclusion, the integrated approach of SLIs, SLOs empowers organizations to:
Quantify Performance:
SLIs provide the essential quantitative metrics (latency, availability) that serve as the foundation for measuring a service’s actual performance from the user’s perspective.
Set Clear Goals:
SLOs define specific, internal targets for these metrics, acting as a shared understanding across engineering and product teams for what constitutes an acceptable level of service quality.
Manage Expectations and Accountability:
While SLOs are internal goals, they support formal, external SLAs that set clear expectations with customers and define the consequences of not meeting agreed-upon service levels.